MarketNetra Blog
Trading Insights for
Indian Markets
F&O strategies, market analysis, and trading education — written for NSE & BSE traders.

Overtrading in Indian Markets: Signs, Costs, and a Rule-Based Fix
Overtrading silently destroys trading accounts through brokerage drag and poor decisions. Learn the warning signs, measure your real cost, and build rules to trade less but better.

Paper Trading in India: Best Free Simulators to Practice Without Losing Money
Start practising trades without risking real money. We compare the best free paper trading and virtual trading platforms available for Indian markets including NSE and BSE.
Nifty Bank Constituents and Weightage: How RBI-Sensitive Stocks Move the Index
Know which stocks drive BANKNIFTY and their exact weightage. Understand how HDFC Bank, ICICI Bank, and SBI disproportionately move the index and how to trade around it.

Income Tax on F&O Trading in India: ITR Filing, Audit, and Tax-Saving Tips
Everything about taxation on F&O trading profits in India — business income vs speculative, ITR forms, tax audit threshold, and legal ways to reduce your tax liability.

How to Pick Stocks for Intraday Trading in India: Checklist and Screener Setup
A practical checklist for selecting the right stocks for intraday trading on NSE. Covers liquidity, volatility, sector momentum, pre-market gap filters, and screener setup.

Bollinger Bands Strategy for Indian Stocks: Squeeze, Breakout, and Mean Reversion
Master Bollinger Bands for NSE trading. Learn the squeeze setup for breakouts, mean reversion entries, and how to combine bands with RSI and volume for higher accuracy.

How to Trade Election Results Day in Indian Markets: Historical Data and Strategy
Analyse how NIFTY and BANKNIFTY have historically behaved on election result days. Learn IV expansion patterns, options strategies, and risk management for this high-volatility event.

Debt-to-Equity Ratio for Indian Stocks: How to Screen and Interpret on NSE
Learn how to analyse the debt-to-equity ratio for NSE-listed companies. Understand what constitutes a healthy ratio by sector, and screen for low-debt stocks using free tools.

What Is Theta Decay in Options? How Time Erodes Your Premium Every Day
Theta decay is the silent killer of option buyers. Learn exactly how time erosion works, when it accelerates, and how sellers use it to their advantage in NIFTY options.

Fibonacci Retracement on NIFTY: How to Draw Levels and Trade Pullbacks
Learn to apply Fibonacci retracement on NIFTY charts like a pro. This guide covers how to draw levels correctly, identify high-probability pullback zones, and combine with other indicators.
STT, CTT, and Brokerage Charges in F&O: Hidden Costs Eating Your Profits
Understand every hidden cost in F&O trading — STT, CTT, stamp duty, GST, exchange charges, and brokerage. See how they add up and eat into your options trading profits.
VWAP Trading Strategy for Indian Stocks: Intraday Setups That Work on NSE
Master the VWAP indicator for intraday trading on NSE. Learn how institutional traders use VWAP, and discover practical setups for entries, exits, and trend confirmation.

How to Calculate Profit and Loss in F&O Trading: Complete Guide With Examples
A step-by-step guide to calculating profit and loss in futures and options trading on NSE. Includes lot size, premium decay, brokerage, STT, and net P&L examples.
Intraday Trading Rules in India: SEBI Margins, Square-Off, and Broker Policies
Everything you need to know about intraday trading rules in India — SEBI margin requirements, auto square-off timings, and broker-specific policies that affect your P&L.
Supertrend Indicator for NIFTY: Settings, Strategy, and Backtested Results
Learn how to use the Supertrend indicator on NIFTY with optimal settings. We backtest multiple configurations on NSE data to find what actually works for intraday and swing traders.

How to Use Open Interest to Predict Nifty Direction: A Step-by-Step Guide
Swing Trading Stocks in India: 3-Day to 3-Week Setups With Entry, Exit, Stop Loss

Indian Market Seasonality: Which Months Are Best and Worst for NIFTY? (20-Year Data)
MACD Indicator for NIFTY: Settings, Signals, and Avoiding False Crossovers
How to Read an Annual Report as an Indian Investor: Key Sections That Matter
Circuit Breakers on NSE: How Stock and Index Circuits Work and What to Do
Candlestick Patterns That Actually Work in India: Data-Tested on NSE Stocks

F&O Margin Calculator: Understanding SPAN, Exposure, and Overnight Margins on NSE

How Dividend Yield Stocks Work in India: Screening and Strategy for Income Investors

Systematic Investment Plan (SIP) vs Lump Sum in Indian Markets: Data-Backed Analysis
Futures Rollover Analysis: How to Read NIFTY and BANKNIFTY Rollover Data Each Expiry
EMA vs SMA for Indian Stocks: Which Moving Average Works Better on NSE?

Bulk Deals vs Block Deals on NSE/BSE: How to Use Them as Trading Signals

SEBI Registration for Stock Tips: Why Paid Telegram Channels Are Illegal in India
How to Use RSI for Indian Stocks: Avoiding the Traps Retail Traders Fall Into

Nifty Next 50 vs Nifty 50: Hidden Alpha in the Junior Index Explained

Global Market Cues for Indian Traders: What SGX, Dow Futures Tell NIFTY at Open

How to Trade Results Day: Options Strategy for Earnings Announcements in India

Stop Loss Orders in India: Types, Placement, and Common Mistakes F&O Traders Make
52-Week High Breakout Strategy: How to Trade NSE Stocks at New Highs

NIFTY 50 vs NIFTY Midcap 150: How to Allocate Between Large and Mid Caps

Delivery Percentage vs Intraday Volume: How to Spot Smart Money Accumulation

Muhurat Trading 2026: How to Trade on Diwali and What Stocks to Watch

How to Read Quarterly Results: A Trader's Guide to Earnings Season in India

Promoter Shareholding in India: Why It Matters and How to Read Pledge Data
RBI Policy Day Trading: How NIFTY Reacts to Rate Decisions and How to Trade It

Budget Day Trading Strategy: How Indian Markets Behave on Union Budget Day

NSE Stock Screener: How to Find Breakout Stocks Daily Using Free Tools

PE Ratio for Indian Stocks: How to Use It Correctly and When It Lies

Zerodha vs Groww vs Angel One: Best Broker for F&O Trading in India 2026
NIFTY Rollover Data Explained: What Rollover Percentage and Cost Tell You
Rollover data tells you how confidently the market is carrying positions into the next series. A high rollover with rising cost signals bullish conviction; low rollover with falling cost means bears are in control. Here's the complete decoder.
Short Covering vs Long Buildup in NIFTY: How to Read OI + Price Action Together
Short covering rallies look exactly like genuine breakouts for the first 30 minutes. Learn to read the OI + price action matrix — the four combinations (short covering, long buildup, short buildup, long unwinding) and what each means for your next trade.

How to Backtest a Trading Strategy in India: Free Tools and NSE Data Sources
Backtesting in Indian markets is harder than the US — NSE historical options data isn't freely available. Here's where to get it, which free tools work for NIFTY F&O backtests, and the traps that invalidate most results.

How AI Predicts NIFTY Movement: What the Models Actually Use (And What They Can't)
AI trading systems for NIFTY use a mix of price history, option chain OI, FII flows, and sentiment signals — but none of them predict the future reliably. Here's what the best models actually do, and what their real limits are.

Best AI Stock Screeners for Indian Markets in 2026: NSE Tools Compared
The Indian market now has a dozen AI-powered stock screeners — but which ones actually surface actionable signals before the crowd? We test and compare the top tools on NSE data quality, F&O filters, and alert speed.

BANKNIFTY Strangle vs Straddle: Which Works Better in Range-Bound Markets?
Strangles are cheaper than straddles but require larger moves to profit. Compare both on BANKNIFTY-specific volatility metrics, capital efficiency, and breakeven spreads — and learn when each setup has an edge.
BANKNIFTY Scalping vs Swing Trading: Risk/Reward and Position Sizing Compared
BANKNIFTY's volatility makes scalping faster but riskier. Compare Greeks decay rates, position sizing rules, and realistic profit targets for scalping (5-min charts) vs swing (hourly) timeframes — with real P&L examples.

NIFTY Volatility Smile and Skew: What Option Chain Greeks Tell You About Market Fear
NSE option chains display volatility smiles that indicate market maker risk preferences and retail fear. Extract implied volatility across strikes, calculate skew percentages, and spot mispriced options before big events.

AI Trading Alerts for BANKNIFTY: Building a News Sentiment Signal Engine
Build an NLP pipeline that processes Indian financial news (ET Markets, Moneycontrol), calculates sentiment scores, and fires options alerts when news sentiment diverges from option chain OI. Full Python setup included.
FII/DII Option Positioning: How to Track Institutional Hedging in Option Chain Data
FII/DII option positioning — put/call ratio skew, put spreads — reveals institutional hedging intent before big moves. Learn to correlate SEBI's FII/DII data with option chain changes to predict reversals.

NIFTY Butterfly Spread: Low-Cost Defined-Risk Strategy for Range-Bound Markets
Butterflies offer defined risk and lower theta decay than naked options, but require precise strike selection. Learn Greeks-based construction, profit zones, and why butterflies suit NIFTY's tight expiry windows.

BANKNIFTY Ratio Call Spread: Leveraging Asymmetric Payoffs with Low Capital
Ratio spreads offer asymmetric risk/reward but require precision — especially in a high-volatility index like BANKNIFTY. Master setup, Greeks management, and adjustment rules to avoid the hidden naked leg blowing up.
NSE Block Deals Monitoring: Detecting Institutional Moves Before They Hit Price
NSE publishes block deal data every day. Learn to extract and analyze block deals, identify accumulation patterns, and trade ahead of institutional repositioning — a signal most retail traders completely ignore.
NIFTY Options by Days to Expiry (DTE): Which Strategy for 0-2 DTE vs 8+ DTE
Scalping (0-2 DTE), swing (3-7 DTE), positional (8+ DTE) — each window demands a completely different strategy. Map your approach to the NSE expiry calendar using gamma and theta effects by DTE.
Trading India VIX During Market Panic: Strategies for Volatility Surges Above 25
When India VIX spikes above 25, specific options strategies pay off while others blow up. Learn panic-mode setups, delta hedging during selloffs, and how VIX and NIFTY futures move inversely in real crashes.
NSE Closing Bell Strategy: Last 15-Minute Option Chain Moves and Setups
The final 15 minutes of NSE trading create specific gamma-driven moves. Learn closing bell patterns, delta effects, and mechanical entry signals that capture pre-close volatility in NIFTY and BANKNIFTY.
BANKNIFTY vs NIFTY Volatility: How to Adjust Your Strategy for Each Index
BANKNIFTY often trades 20-30% more volatile than NIFTY. Understand how this affects Greeks, position sizing, and strategy selection — and when to switch between straddles, spreads, and directional bets.

NIFTY Iron Condor: Greeks-Based Entry, Adjustment, and Exit Rules
Iron condors require precise delta/gamma management to avoid blown-up losses. Learn Greeks-based entry rules, adjustment triggers, and exit windows optimized for NIFTY's 10-15 DTE expiry window.

How to Build an AI Trading Bot for NIFTY Options Using NSE APIs
Move from manual trading to automation. Build a Python-based trading bot that connects to NSE APIs, monitors option chains, calculates signals, and manages risk. Code-heavy tutorial with real position guards.
BANKNIFTY Delivery Percentage Analysis: Identifying Institutional Conviction
High delivery percentage in BANKNIFTY stocks signals institutional holding, not intraday noise. Extract NSE bhav copy delivery data, correlate with F&O volumes, and identify stocks primed to sustain moves.

IV Crush in NIFTY Options: How to Trade the Volatility Drop After Events
Index options experience IV crush differently than single stocks due to aggregation effects. Master the timing, Greeks impact, and profit window for short premium strategies around RBI policy days and earnings season.

AI-Driven Sector Rotation Prediction for Indian Markets: NLP on Financial News
Train an NLP model on Indian financial news to predict sector sentiment shifts before they reflect in NIFTY sector indices. Includes free data sources from Economic Times and Moneycontrol, plus a Python implementation.

NIFTY Open Interest Spurts: Detecting Institutional Accumulation Before the Move
OI spurts — sudden increases in option positions — often precede directional moves. Learn how to spot them on NSE option chains, calculate OI change percentages, and distinguish real accumulation from noise.

BANKNIFTY Call Spread vs Put Spread: Risk/Reward Breakdown for NSE Traders
Spreads reduce margin and capital at-risk compared to naked options — but which direction works best for BANKNIFTY's volatility? Compare Greeks, breakeven levels, and max profit zones with real NSE examples.
IV Rank for NIFTY Options: When to Sell Premium vs Buy Options
IV Rank tells you if volatility is high or low relative to recent history — critical for deciding premium selling vs buying. Calculate IV Rank from NSE data and build volatility mean-reversion strategies.
NIFTY Weekly vs Monthly Expiry: Which Timeframe Suits Your Trading Style?
Weekly and monthly expirations have different volatility patterns, gamma risk, and profit windows. Learn which suits scalpers, swing traders, and positional traders — with NSE historical volatility data from 2024-26.

NSE Option Chain Data with Python: Automate Your Analysis in 30 Lines
Stop manual option chain screenshots. Build a Python script that pulls live NSE option chain data, calculates OI changes, and triggers alerts. Step-by-step guide using free NSE data sources.

BANKNIFTY Straddle Strategy: Building and Managing Positions with AI Alerts
BANKNIFTY volatility makes straddles attractive but risky. Master setup rules, delta-neutral entry levels, and exit signals that protect theta decay — with real NSE data examples from 2025-26.
NSE Bhav Copy Analysis: Extract Hidden Trading Signals from Daily Data
Bhav copy files contain institutional-grade data that most retail traders ignore. Discover how to parse NSE's daily bhav copy for delivery percentage, block deal patterns, and unusual volumes that precede breakouts.
BANKNIFTY Option Chain Analysis: How to Read OI Distribution Like a Pro
Most retail traders skip the OI distribution patterns in BANKNIFTY option chains, missing critical support/resistance levels. Learn how to identify max pain zones, option stacking patterns, and predict institutional positioning using live NSE data.

How to Read the Nifty Heatmap: Sector Strength and Weakness at a Glance
The NIFTY heatmap is one image that tells you where institutional money is flowing today. Here's how to read it in 30 seconds — and the three signal patterns that actually matter for trading decisions.

Understanding Option Greeks for Indian Markets: Delta, Theta, Gamma Simplified
Delta tells you direction. Theta tells you time. Gamma tells you speed. Vega tells you volatility. Here's how each of the Greeks actually behaves in NIFTY options — and which ones matter for different strategies.
Best Time to Trade NIFTY Options: Hour-by-Hour Data Analysis
9:15 AM. 11:30 AM. 2:30 PM. Each hour of the NIFTY session has a different volatility, liquidity, and probability signature. Here's the data on when to trade — and when to stand aside.
How Algorithmic Trading Affects Retail Traders in India
Post the Jane Street episode, every retail trader is asking the same question: am I being front-run? Here's what HFT actually does to retail option buyers — and what you can do about it.

Nifty Expiry Day Analysis: Patterns, Data, and What Smart Traders Watch
Expiry day has its own physics. Gamma dominates, OI shifts violently, and the last 90 minutes set up the biggest opportunities of the week. Here's the pattern book, with data from 2025-26.
SEBI's New F&O Rules Explained: What Changed and How It Affects Your Trading
SEBI tightened F&O in 2024-25 with higher lot sizes, single weekly expiry, and STT changes. Here's a plain-English breakdown of what changed, what's coming next, and how to adapt.

FII vs DII: Who's Really Driving the Indian Stock Market in 2026?
For a decade, FIIs moved the Indian market. That changed in 2024. Here's the data on who's actually driving NIFTY in 2026 — and why DIIs and retail flows now matter more than Wall Street does.

Trading Journal for Indian Traders: Why You Need One and How to Start
The traders who stay profitable across years all do one thing: they journal. Here's exactly what to track for Indian F&O trades — and the templates that make it actually sustainable.

Position Sizing for F&O Traders: The One Skill That Saves Accounts
Most F&O traders obsess over entries and exits. The ones who survive obsess over position size. Here's the math and the mindset that keeps capital alive across losing streaks.

FOMO Trading in Indian Markets: A Trader's Guide to Staying Disciplined
You watched NIFTY break out without you. Now you're about to buy at the top of an extended move. Here's how to recognise FOMO-driven entries — and build systems that eliminate them entirely.

Revenge Trading: How to Recognise It and Stop Before You Blow Up
The first loss stings. The second one lights a fire. The third one is revenge trading — and it's how most F&O accounts die. Here's how to catch it in the moment and actually stop.

Why 91% of Indian F&O Traders Lose Money: Lessons from SEBI's Data
SEBI's January 2024 study revealed 91% of individual F&O traders lose money. We broke down the data by trader profile, strategy, and time horizon. The patterns will change how you trade.

How to Use SGX NIFTY (Gift NIFTY) for Pre-Market Trading Decisions
GIFT NIFTY trades 21 hours a day at NSE IX. It's the single most reliable predictor of where NIFTY will open the next morning — if you know how to read it. Here's the trader's guide.
Gap Up and Gap Down Trading: How to Analyse Gaps in NIFTY with AI
NIFTY opens 150 points higher. Now what? Here's how to systematically analyse whether a gap will fill, extend, or trap both sides — using pre-market data, GIFT NIFTY, and option chain shifts.
India VIX and Trading: How to Use the Fear Index to Time Your Trades
India VIX at 12 vs 22 vs 32 means very different things for your options positions. Here's how to read the fear index and adjust your F&O strategy for different volatility regimes.

How to Spot a Breakout vs Fakeout Using AI and Volume Analysis
Every breakout looks real in the first 15 minutes. Here's how to separate institutional conviction from algo-driven head fakes using volume, delivery percentage, and OI confirmation.

How to Analyse Sector Rotation in Indian Markets (Step-by-Step)
Money flows from IT to Banks to Pharma to Metals in predictable cycles. Here's how to spot where the institutional money is rotating to in Indian markets — before the move is obvious.
Support and Resistance Using Option Chain Data: A Practical Approach
Forget moving averages. The most reliable support and resistance levels in NIFTY come from where option sellers have parked their money. Here's how to read them in real time.
Implied Volatility Explained for Indian Options Traders (With NIFTY Examples)
Implied volatility doesn't predict direction — it predicts magnitude. Here's how Indian options traders can use IV percentile, IV rank, and IV skew to time entries and exits in NIFTY and BANKNIFTY options.
How to Use FII DII Data for Trading: The Complete Guide
FII sold ₹8,000 Cr. DII bought ₹10,000 Cr. What does this actually mean for your trade tomorrow? Here's how to read FII/DII flows beyond the headline number — and when to ignore them entirely.
Max Pain in NIFTY Options: What It Is, How to Calculate, and Does It Actually Work?
Max Pain theory says NIFTY drifts toward the strike where option writers lose least. We break down the math, show live data examples, and honestly assess whether it works on expiry day.
Best F&O Strategies for Weekly Expiry: A Data-Backed Guide
Iron condor, short strangle, calendar spread, credit spread — which F&O strategy actually works on NIFTY weekly expiry? We ran the numbers on 52 expiries. Here's what the data shows.
Put Call Ratio (PCR) Explained: How to Use PCR for NIFTY Trading Decisions
PCR above 1 means bearish? Below 0.7 means bullish? Not exactly. Here's how the Put Call Ratio actually behaves across different market regimes in Indian options — with data from 2024-26.
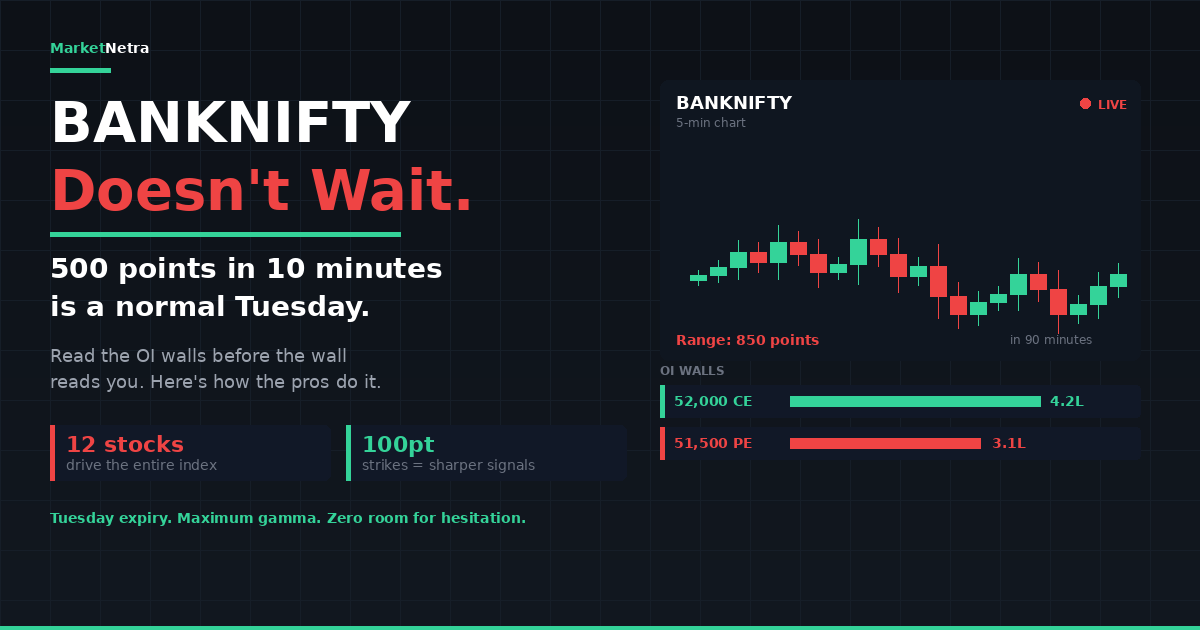
How to Read Open Interest in BANKNIFTY Options Like a Pro
BANKNIFTY moves 500 points in 10 minutes on a normal Tuesday. Here's how pros read the OI walls, PCR shifts, and max pain to stay on the right side of the most volatile index in Indian markets.
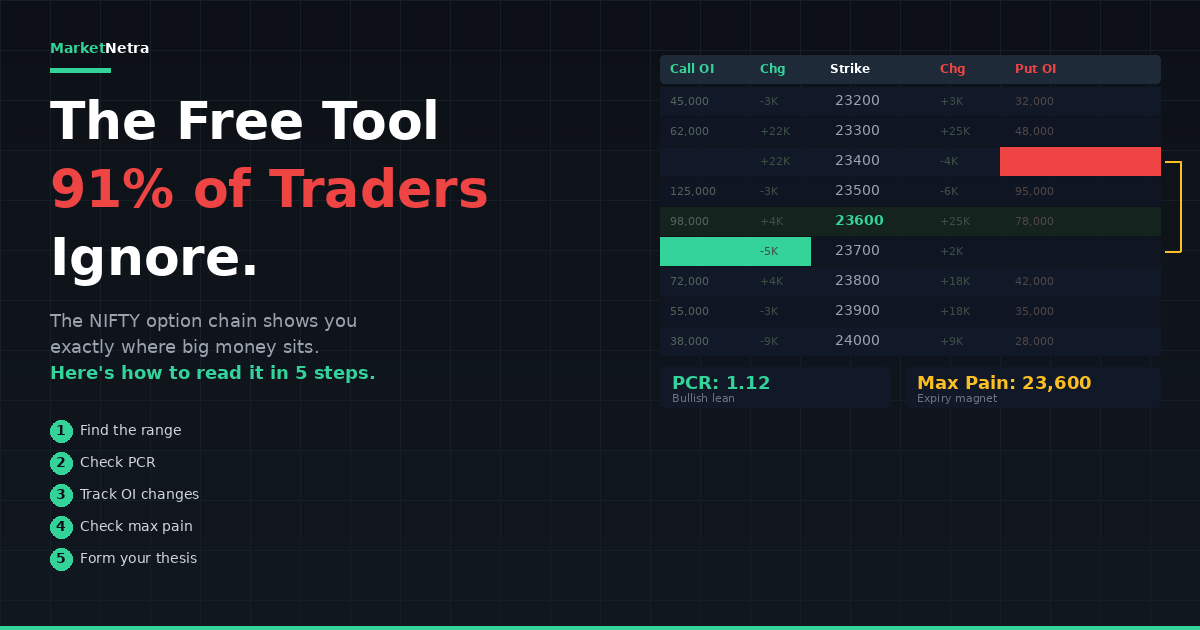
NIFTY Option Chain Analysis: Complete Beginner's Guide (2026)
The NIFTY option chain is free, updates every second, and shows where big money sits. Yet 91% of traders ignore it. Learn to read OI, PCR, max pain, and support/resistance in 5 steps.
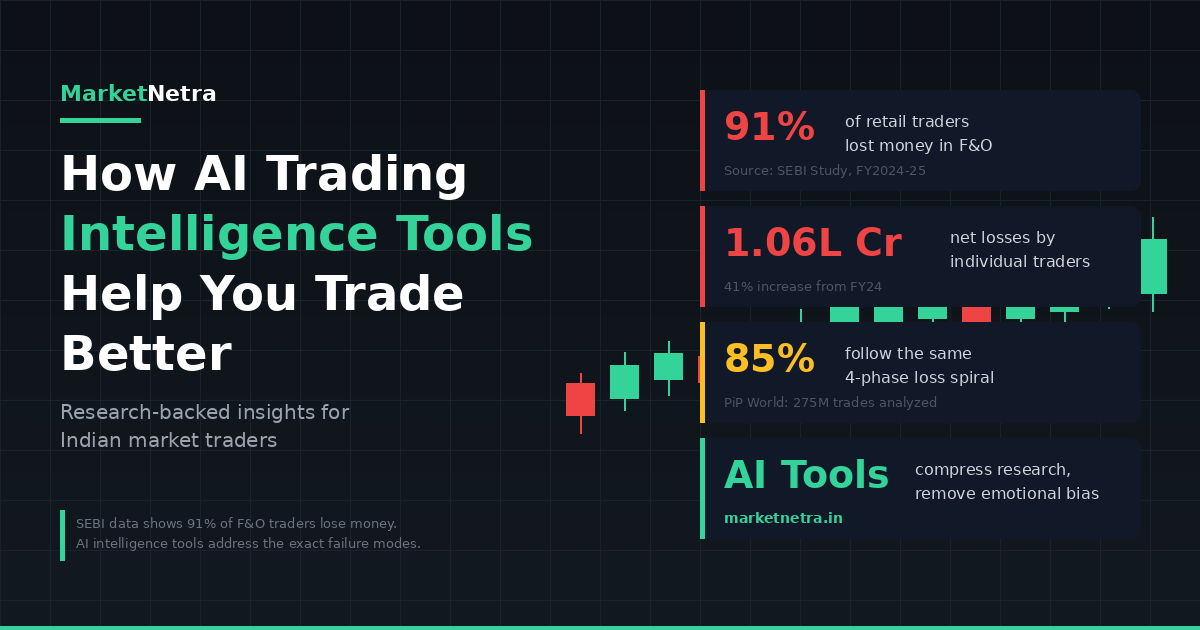
How AI Trading Intelligence Tools Can Help You Trade Better — And Why Indian Traders Need Them Now
91% of Indian F&O traders lost money in FY2024-25. The problem isn't lack of data — it's emotional biases and poor synthesis. Here's how AI trading intelligence tools address the exact failure modes the research identifies.
How to Read the NIFTY Option Chain Like a Pro
Option chains look intimidating at first — rows of numbers, OI, IV, PCR. Here's how to decode them in minutes and spot where the smart money is positioned.
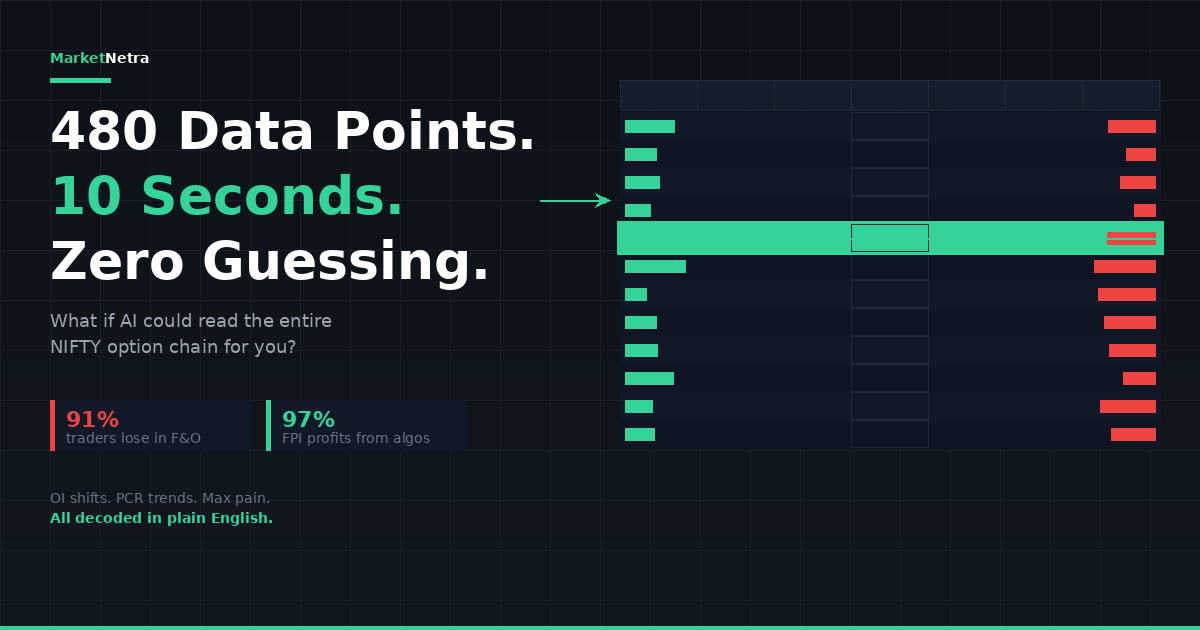
How to Use AI for Option Chain Analysis in Indian Markets
480 data points. Updating every few seconds. Here's how AI trading intelligence transforms option chain analysis from overwhelming to actionable — in plain English.
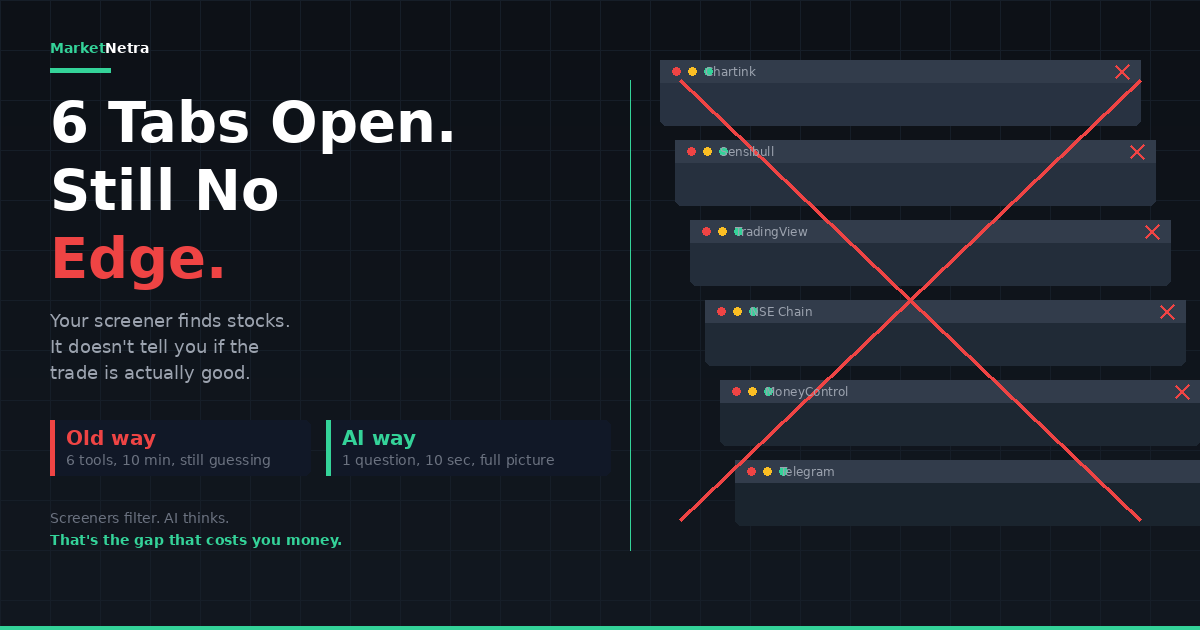
AI Trading Tools vs Traditional Screeners: What Actually Works for Indian Traders (2026)
You have Chartink, Sensibull, TradingView, and 3 other tabs open — but still no edge. Here's what AI trading tools do that screeners can't, and when you should use each.
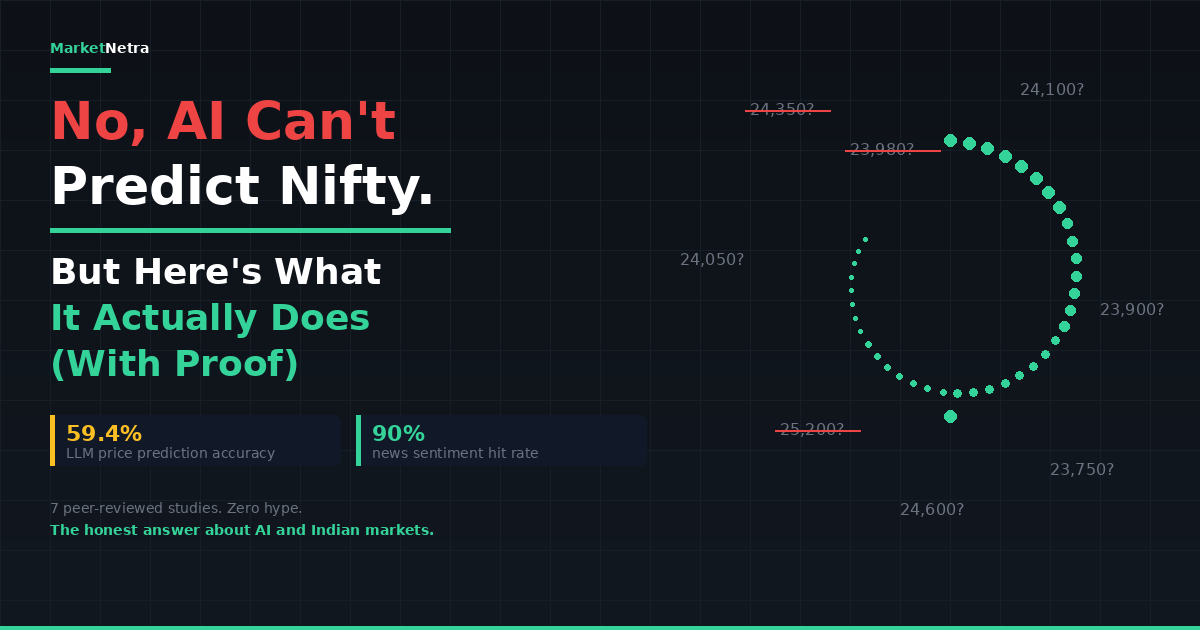
Can AI Predict Nifty Levels? What the Research Actually Says (2026)
No, AI can't reliably predict Nifty's closing price. But 7 peer-reviewed studies reveal what it actually does well — and it's more useful than prediction. The honest answer for Indian traders.
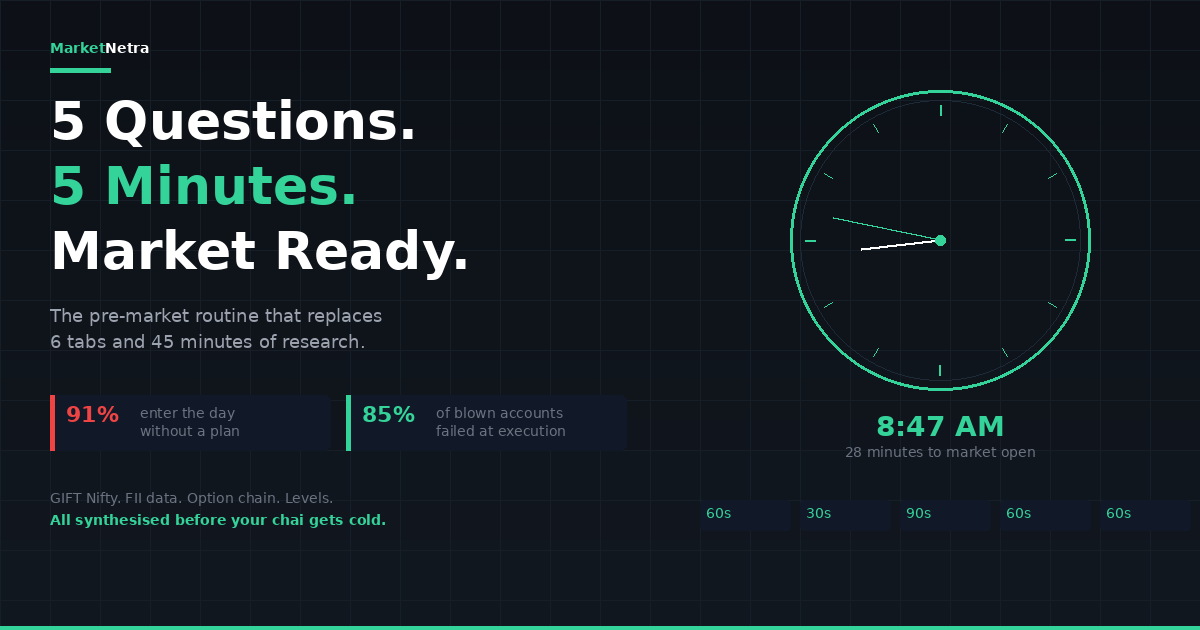
How to Build a Pre-Market Routine Using AI Tools — 5 Minutes, Market Ready (2026)
Most Indian traders start their day checking 6 tabs for 45 minutes. Here's a 5-question, 5-minute AI pre-market routine covering GIFT Nifty, FII/DII, option chains, and key levels.

AI vs Your Gut: Why Data-Driven Trading Beats Intuition — SEBI Data Proves It (2026)
₹1.06 lakh crore lost by Indian F&O traders in one year. 91% lost money. The science of why your gut fails at trading — and how data-driven AI tools fix the exact biases that destroy accounts.